
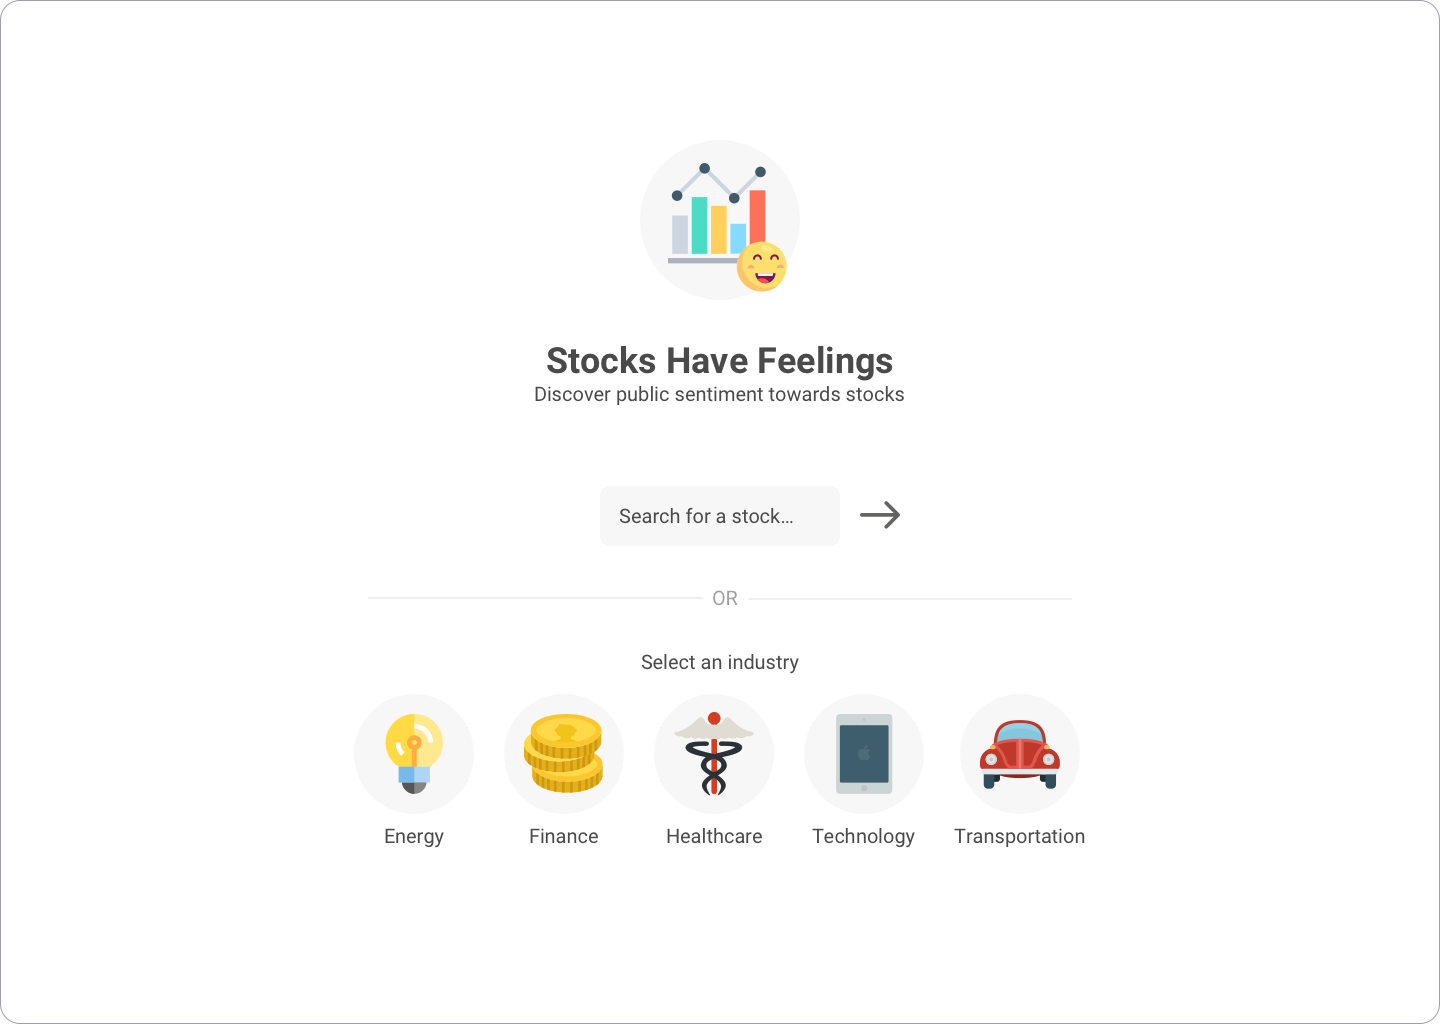
A research tool for novice stock traders that focuses on conveying public sentiment towards company stocks based on social media
Problem Stock trading can seem daunting. When first starting out, new users may feel overwhelmed by the vast number of financial graphs, charts, terminology, and concepts.
This project attempts to address the problem of promoting millennial engagement in stock trading. More specifically, how can beginners be introduced to the stocks in a simple and intuitive way? Logistics
- Project Type: Side Project
- Team: 1 Designer
- My Roles: Research, Interaction Design, Visual Design, User Testing
- Time Frame: 3 Weeks
The research process was split into two phases:
- Collecting data from users and competitors
- Aanalyzing the user data to find themes and insights
To collect user data, observations, interviews, and competitive analysis were conducted on 11 users, who consisted of co-workers, friends, and family members.
After the data was collected, an affinity diagramming exercise was performed to find themes among the pieces of user data. The main findings revealed that:
- Novices feel that there is a barrier of knowledge that makes it difficult to confidently begin stock trading
- Novices feel that researching companies and trading stocks in general would take too much of their time
- Informative: The solution should inform users about the basics of the stock market in an intuitive manner, so that they feel confident to begin stock trading
- Convenient: The solution should feel lightweight and easy to use; users should be able to learn about stocks in short periods of time lasting no longer than a couple minutes
After brainstorming multiple ideas, the elements of the ideas that best addressed the design criteria were synthesized into two main solutions:
- An educational app that walks users through the basics of stock trading and utilizes active learning to encourage user engagement. For example, the first lesson would be about introducing the definition of a stock, and the second lesson would be how to buy stocks. The user would then be asked buy one stock of their choice in order to move forward.
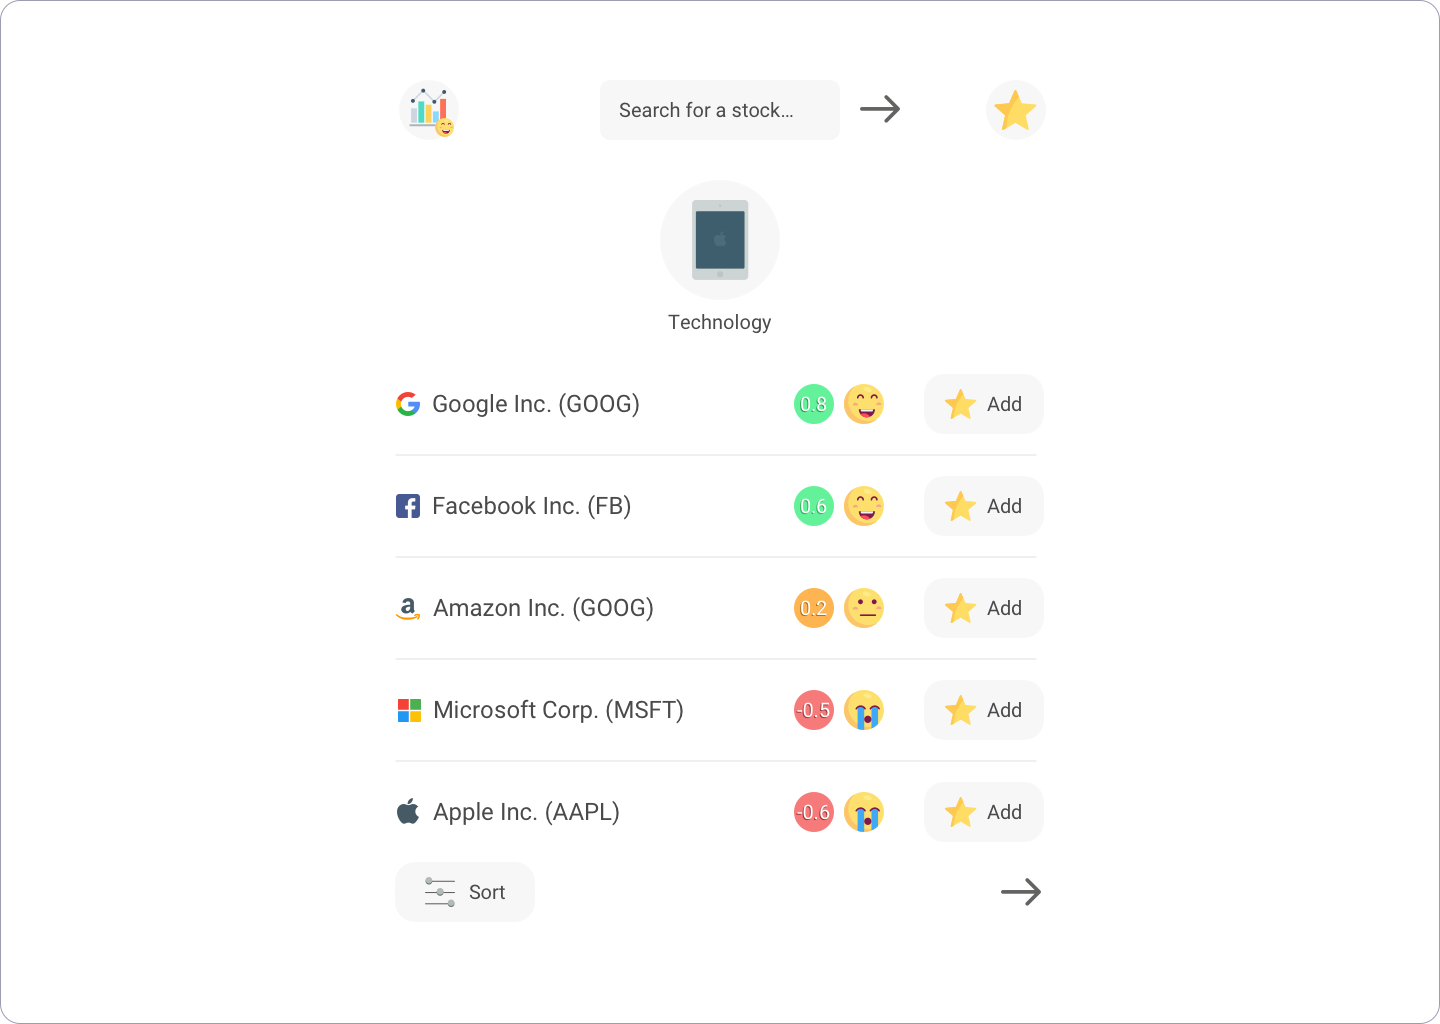
- A web-based research tool that presents stocks through the simple context of sentiment ratings. Sentiment ratings represent the general public's feelings towards a company's stock. These sentiment ratings are generated by analyzing news articles and social media. Users can use sentiment scores to predict changes in stock price. For example, if the general public feels that a certain stock is doing very well and act upon that feeling via buying stocks, then the stock's price is likely to rise as well.
Of the two solutions, the sentiment-rating solution was chosen to move forward.
After additional competitive analysis, it was found that many similar tutorial-based educational apps already exist. In an effort to avoid repeating existing work, the educational app idea was shelved.
Moreover, it was believed that the sentiment-based research tool could help users ease into the world of stock trading by providing them with easy-to-understand, actionable sentiment data. Early Design The early design focused on creating a minimum viable product through rapid prototyping. One of the reasons for keeping the early design lightweight and agile was to output a simple prototype that could then be used to quickly gather early user feedback.
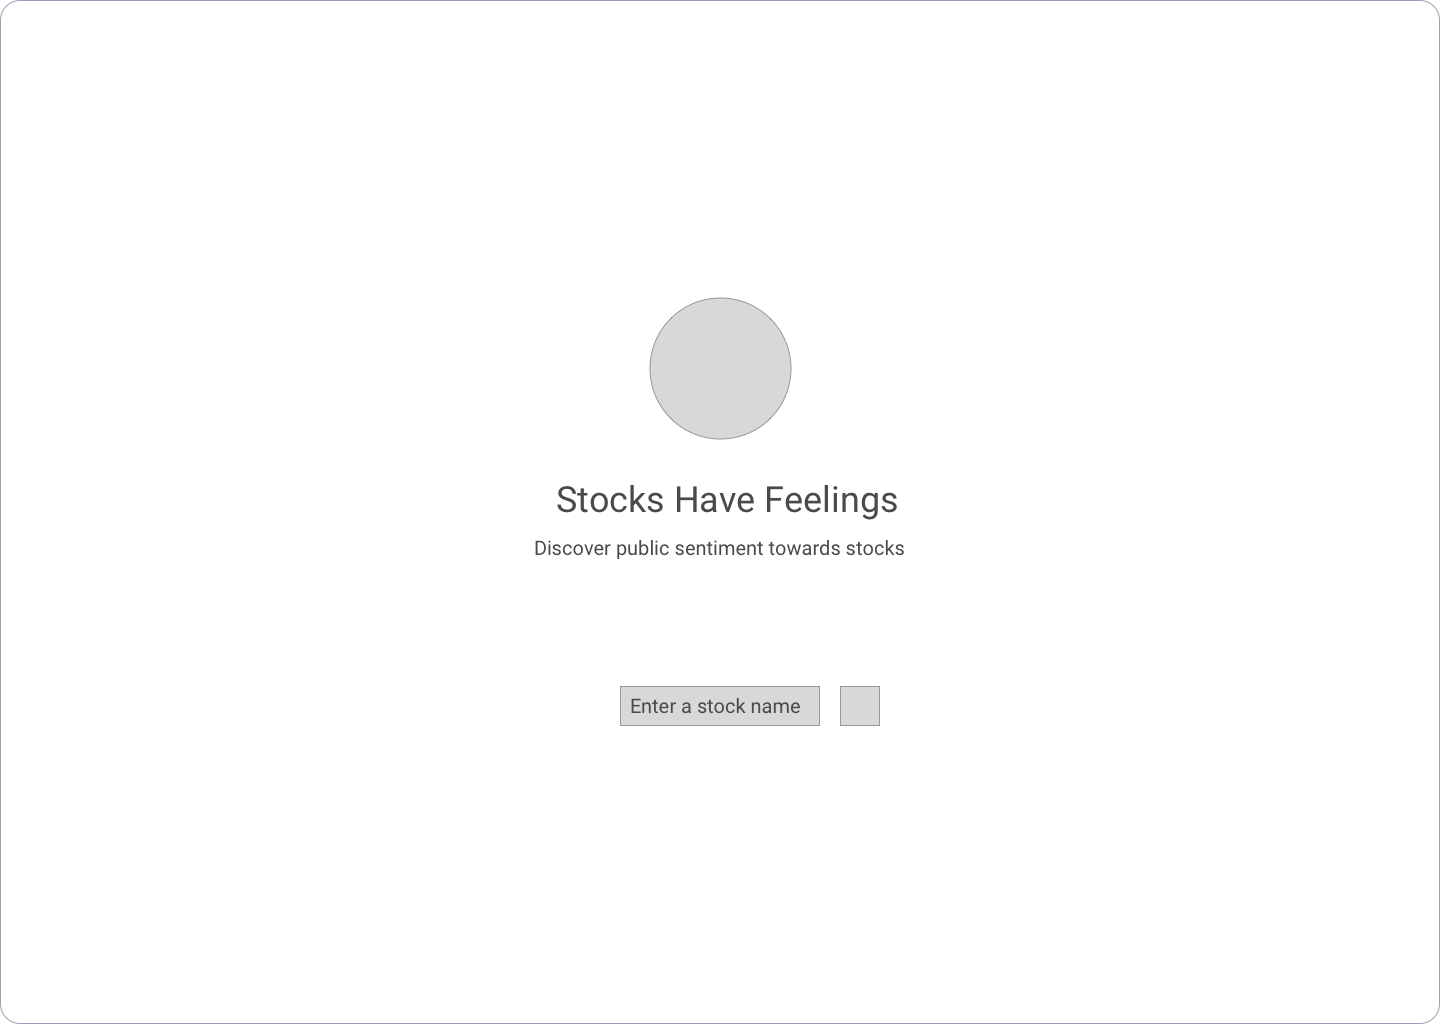
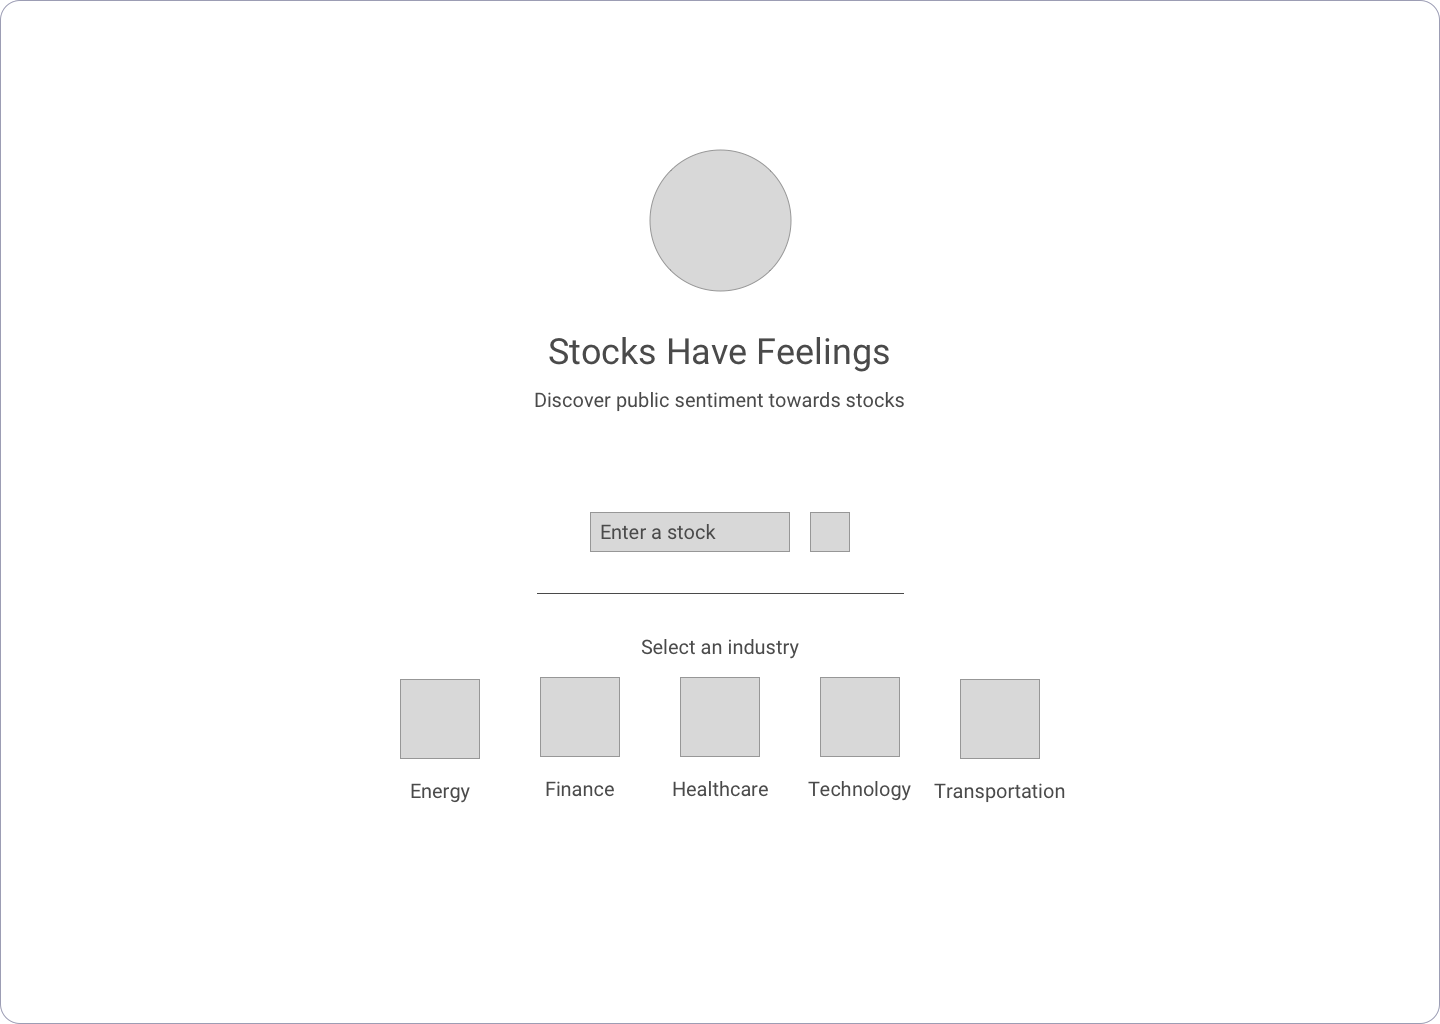
To create an early design, the main benchmark user task of app was determined: discovering a company stock's sentiment rating. Then the benchmark task was broken down into steps to create a user task flow:
- Search for a stock
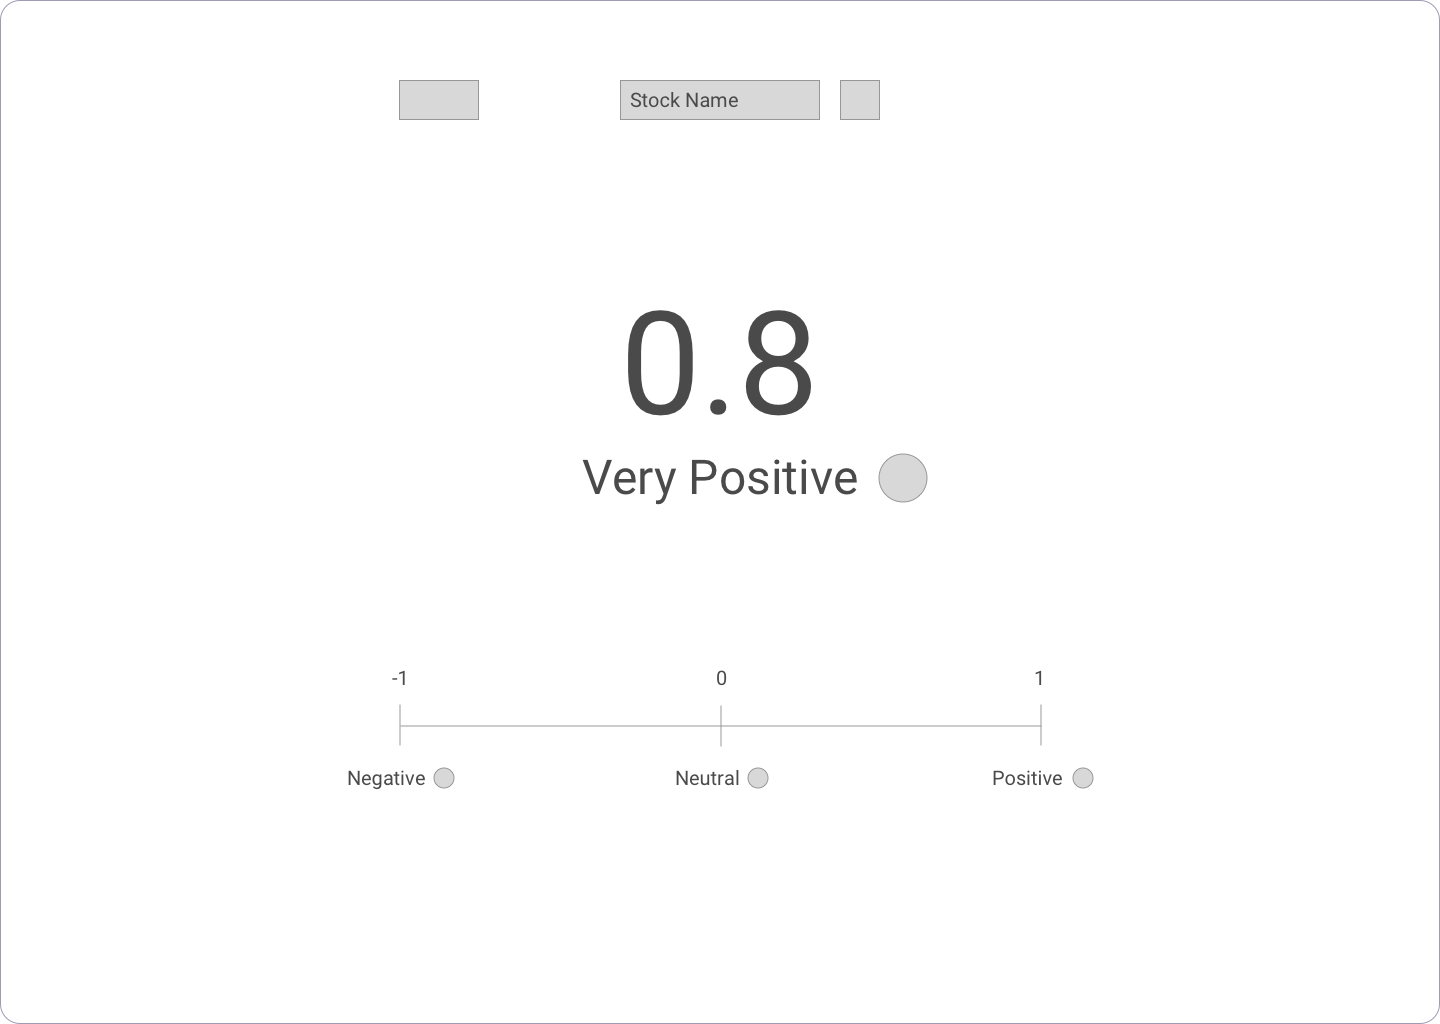
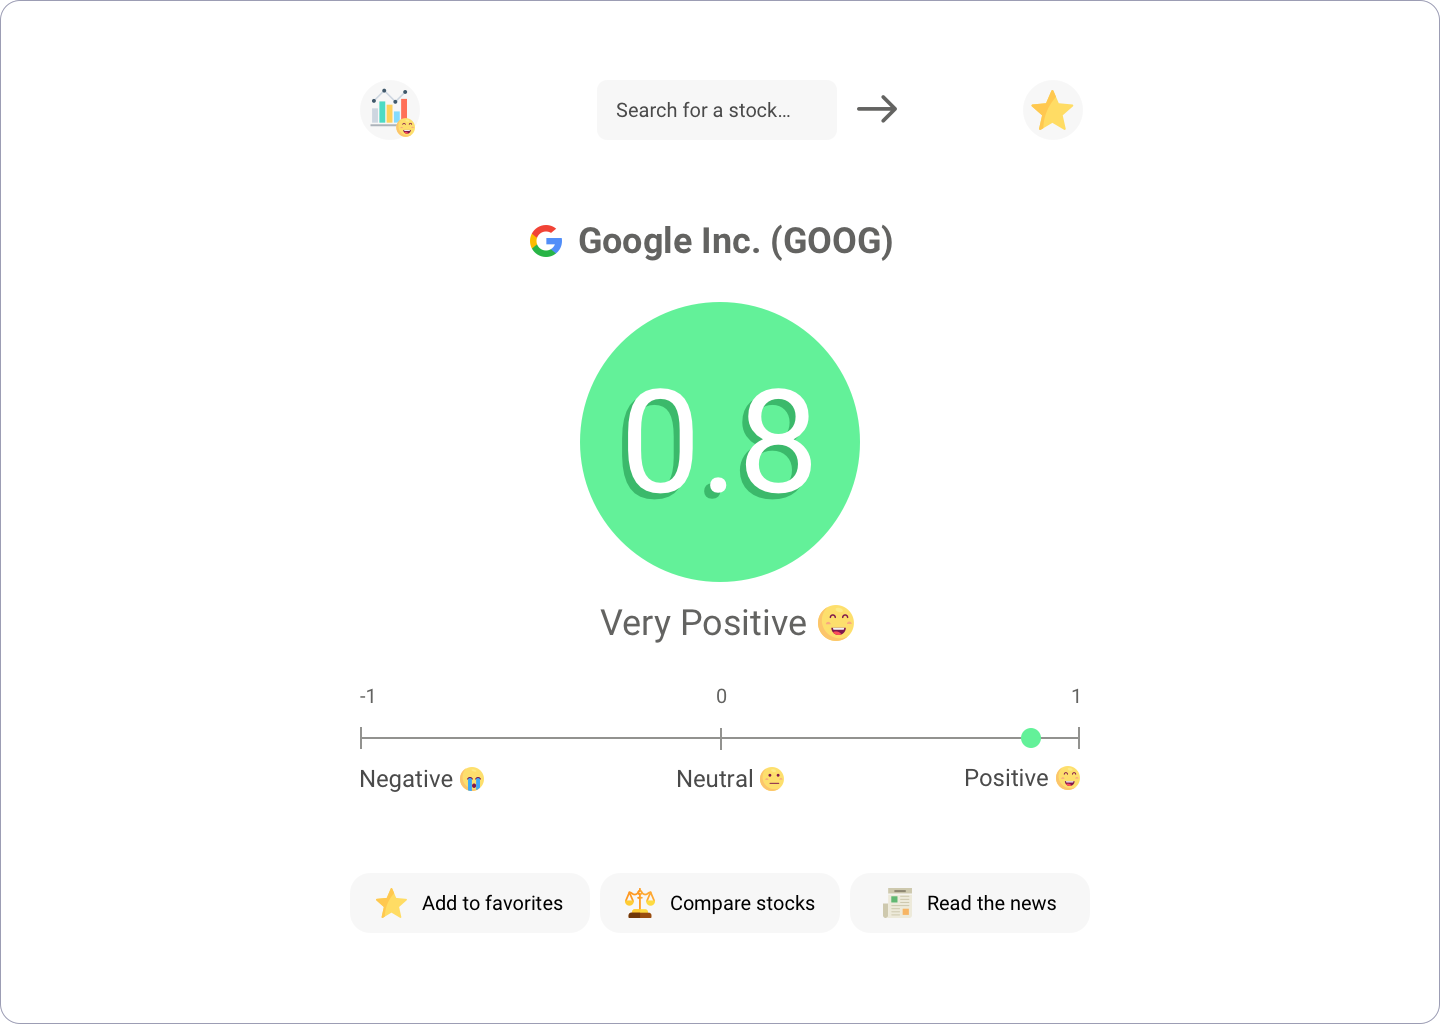
- Understand the sentiment rating
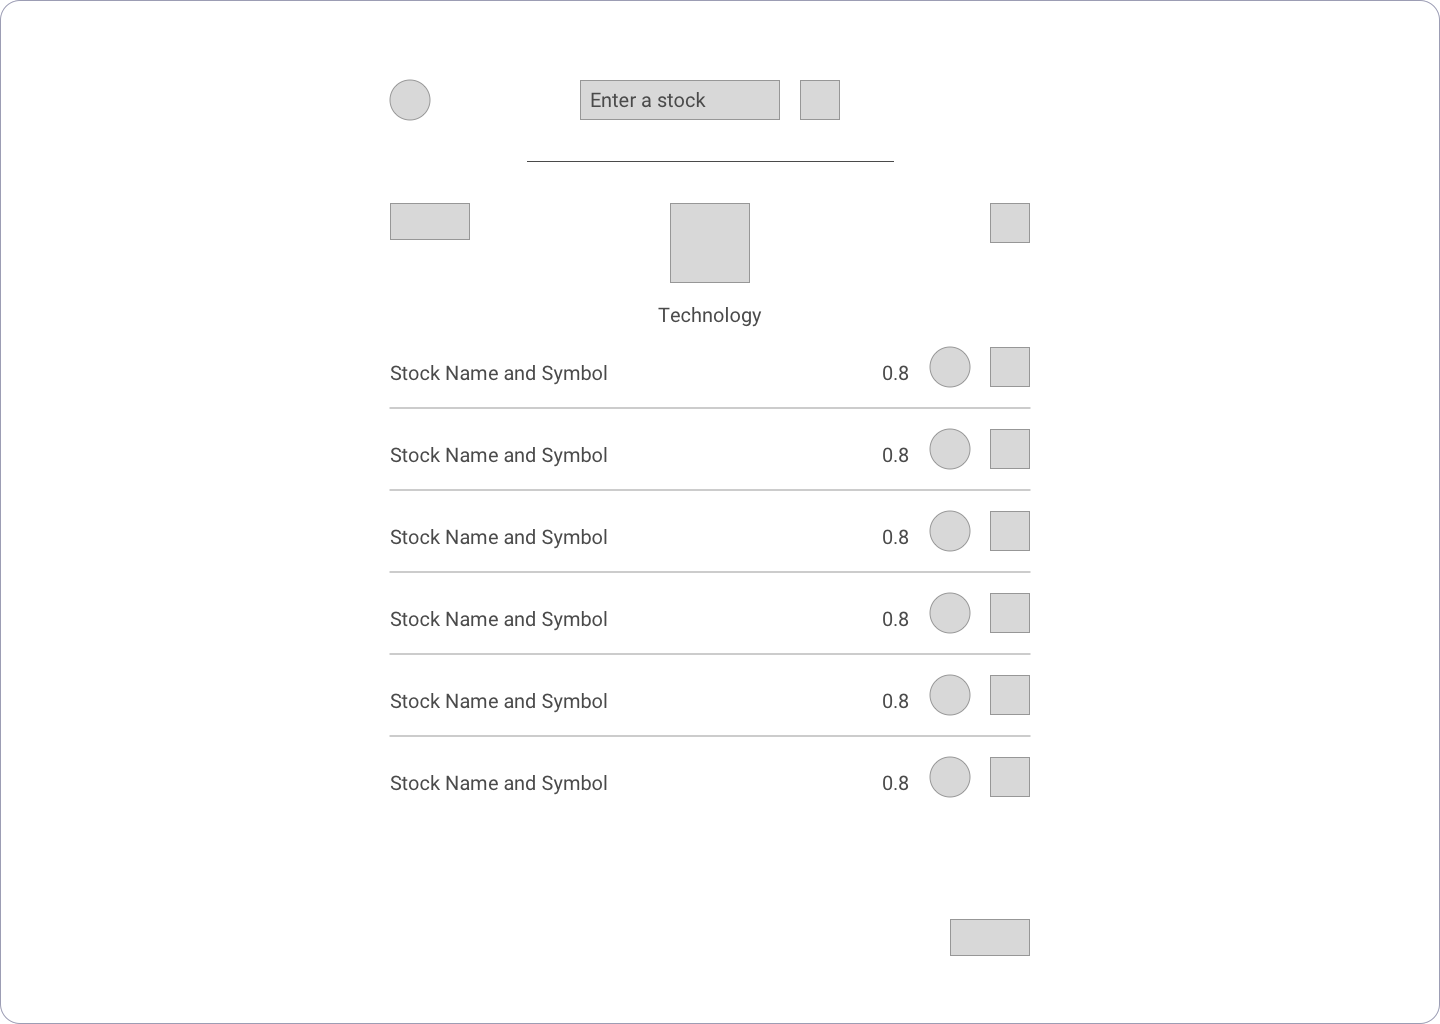
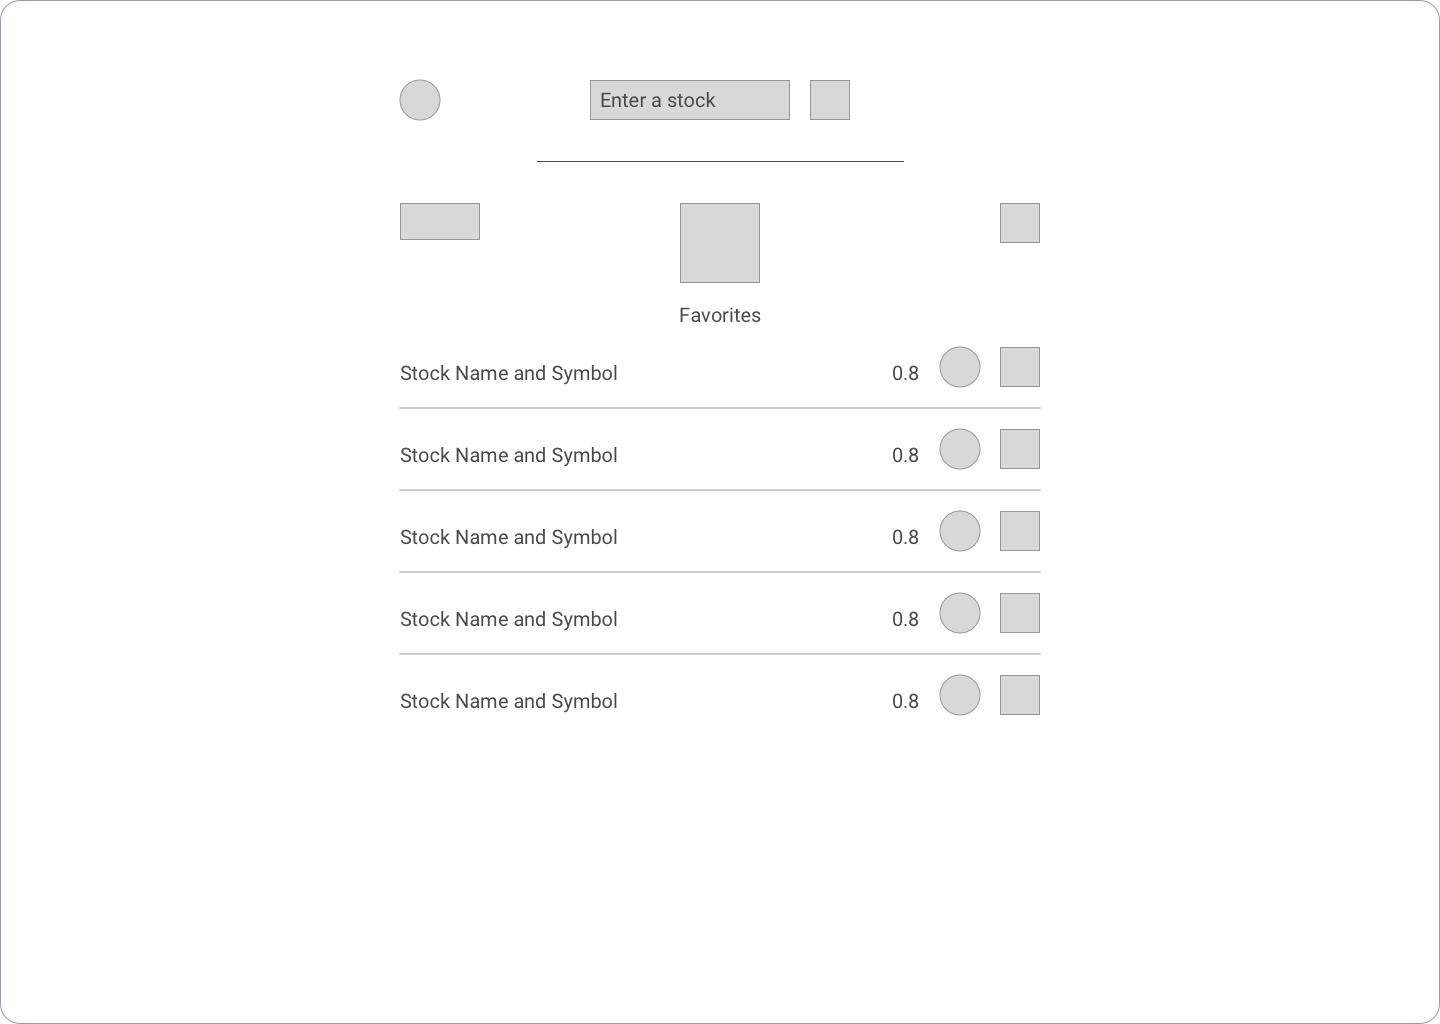
After the task flow was determined, wireframes and mockups that represented steps of the user flow were created in Sketch.
Click to learn more about the sentiment rating system.

Users were presented with the names of five stocks and were asked to look up the sentiment scores of at least two of them. The prototype was built using Sketch's prototyping functionality.
As the users performed the tasks, they were asked to explain their thought process as well as their initial reactions to the interface in real-time. After the task, the users were interviewed to understand their behaviors, thoughts, and feeling and collect any other feedback.
The main findings from user testing revealed:
- Interactions were very simple; searching and getting a result
- Sentiment ratings were clear; could tell if a score meant positive or negative
- Users weren't sure how to make use of the ratings or what to do in terms of next steps
- Users wanted to know more about the background of how user sentiment was determined
- Users felt that the tool was good for searching for sentiment ratings of stocks they already knew about but was not as good for exploration of new stocks
- Users found themselves wanting to compare the sentiment ratings of multiple companies; hard to keep track of multiple stocks at once
- Show list of stocks by industry to encourage exploration of new stocks
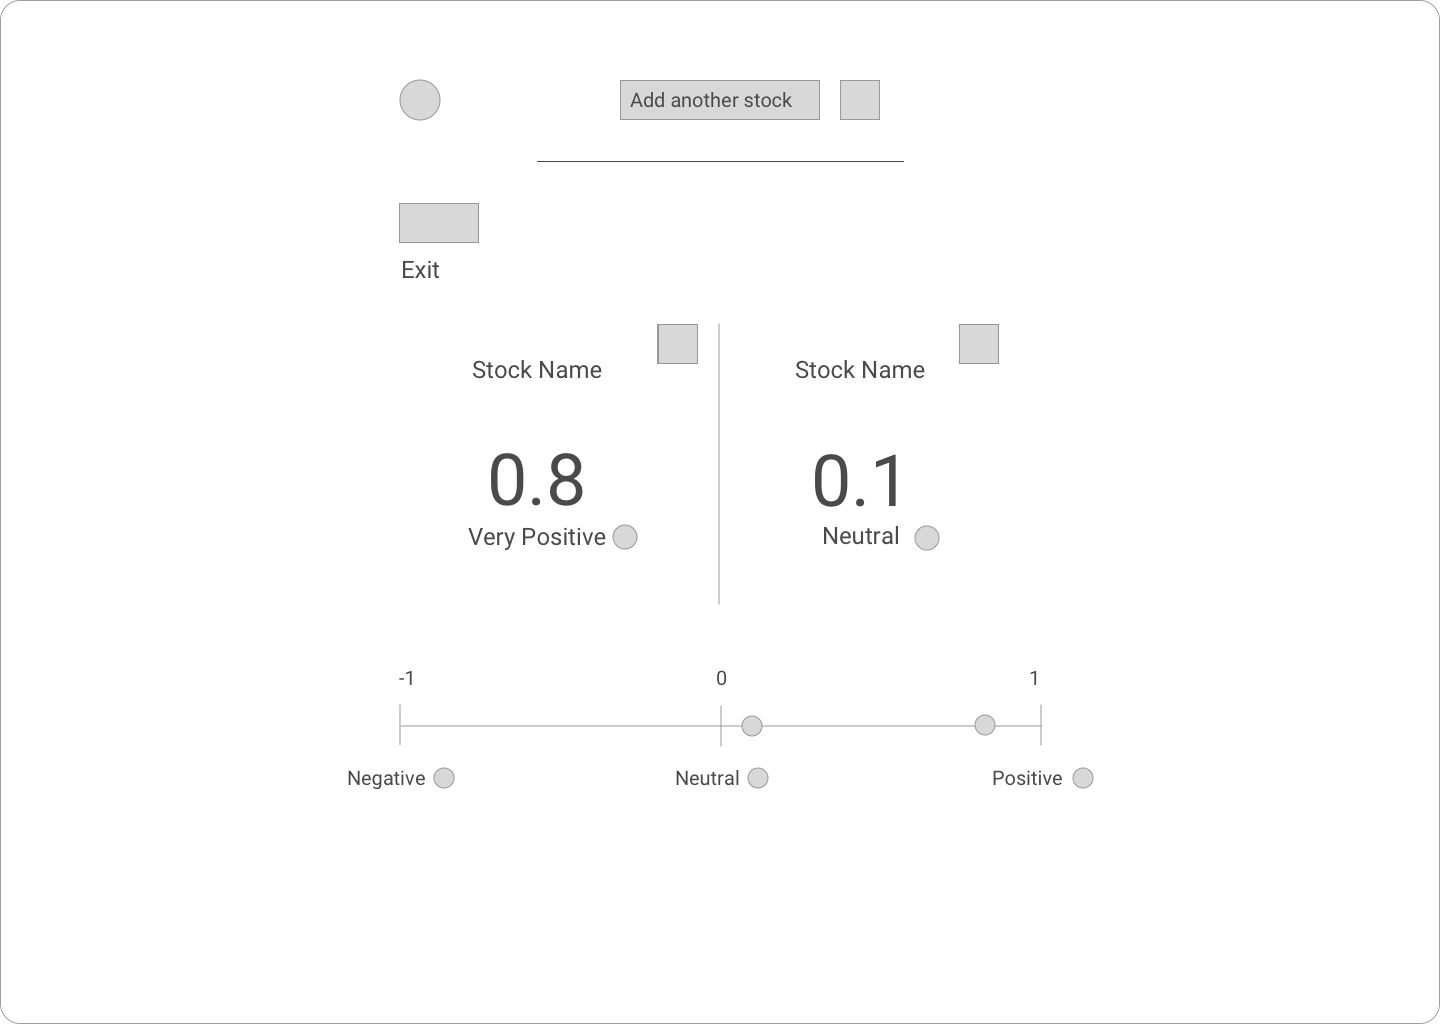
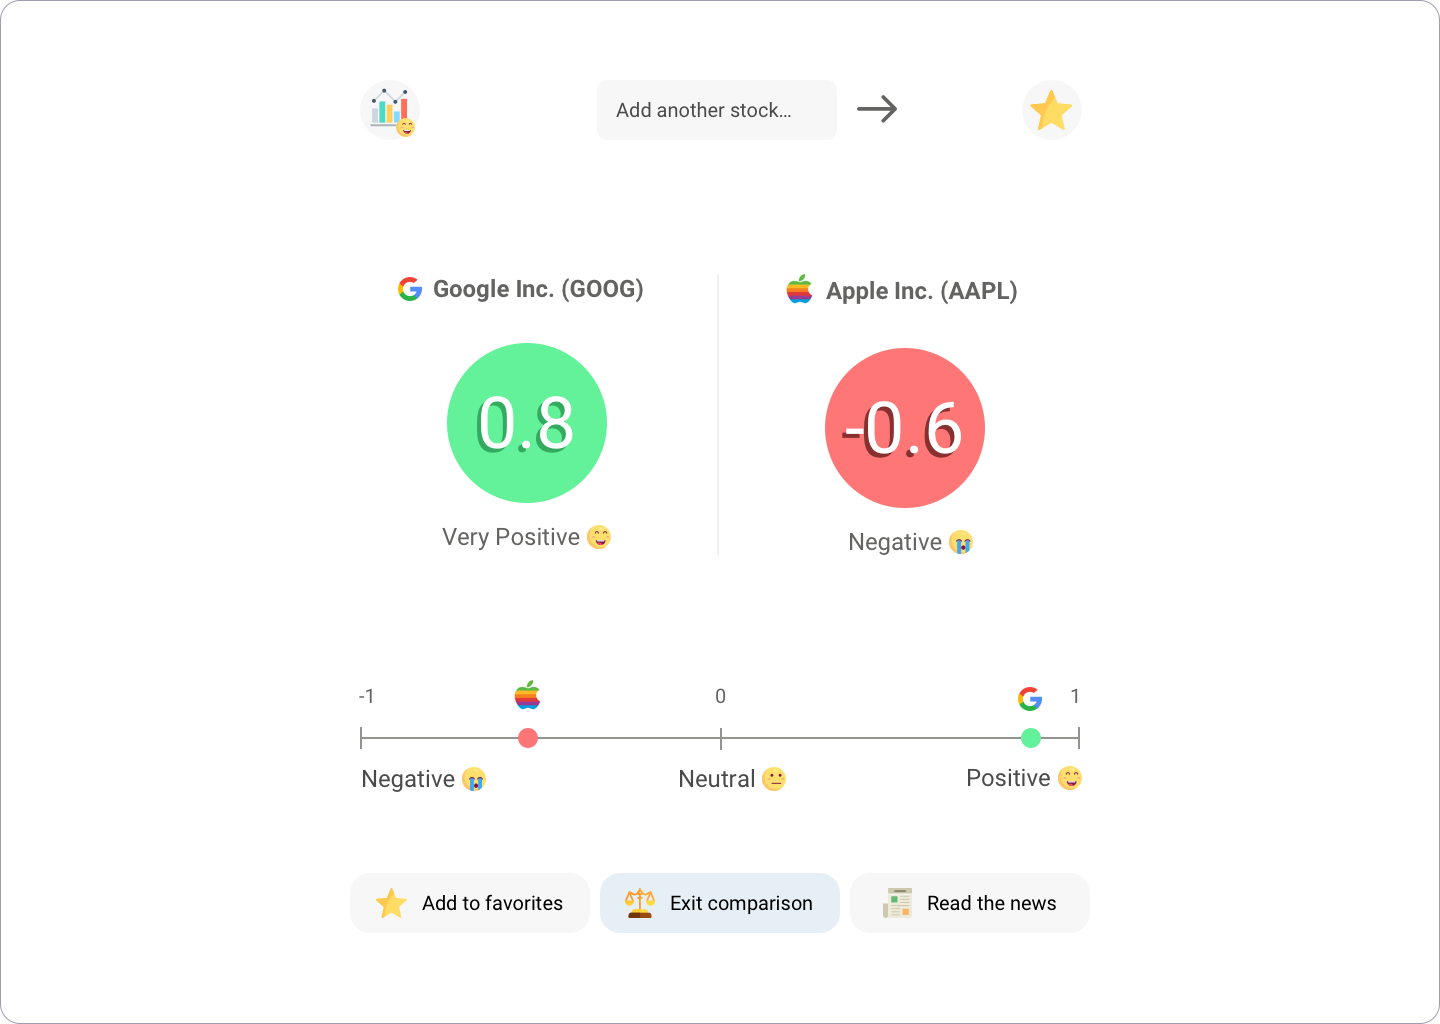
- Compare two or more stocks to allow for contextual analysis
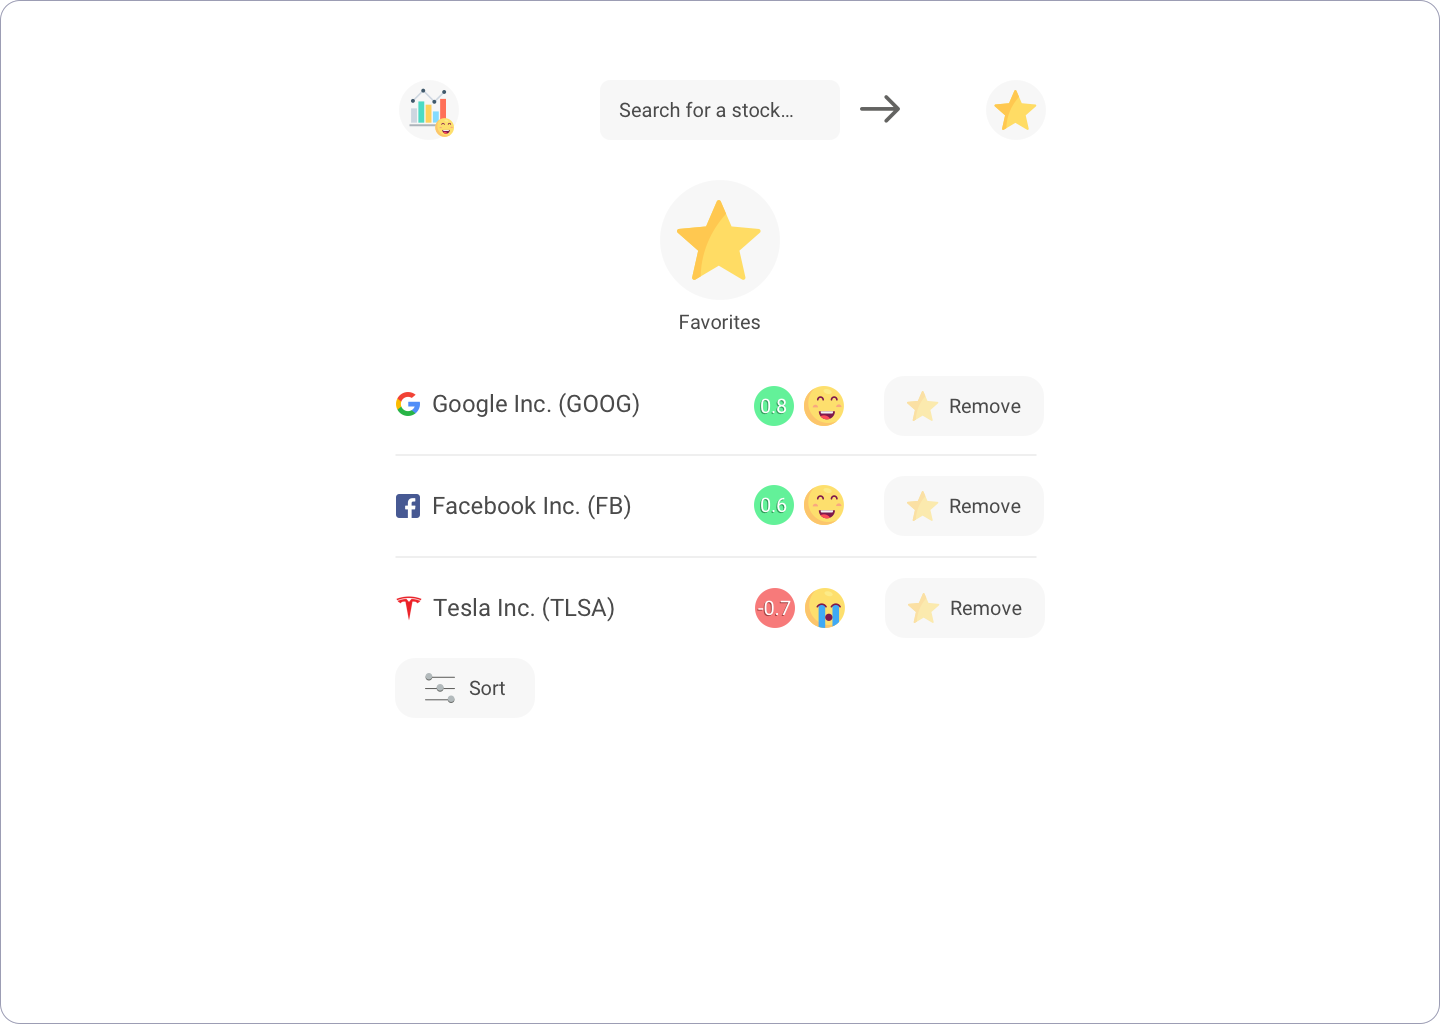
- Add stocks to a favorites list to be able to keep track of certain stocks
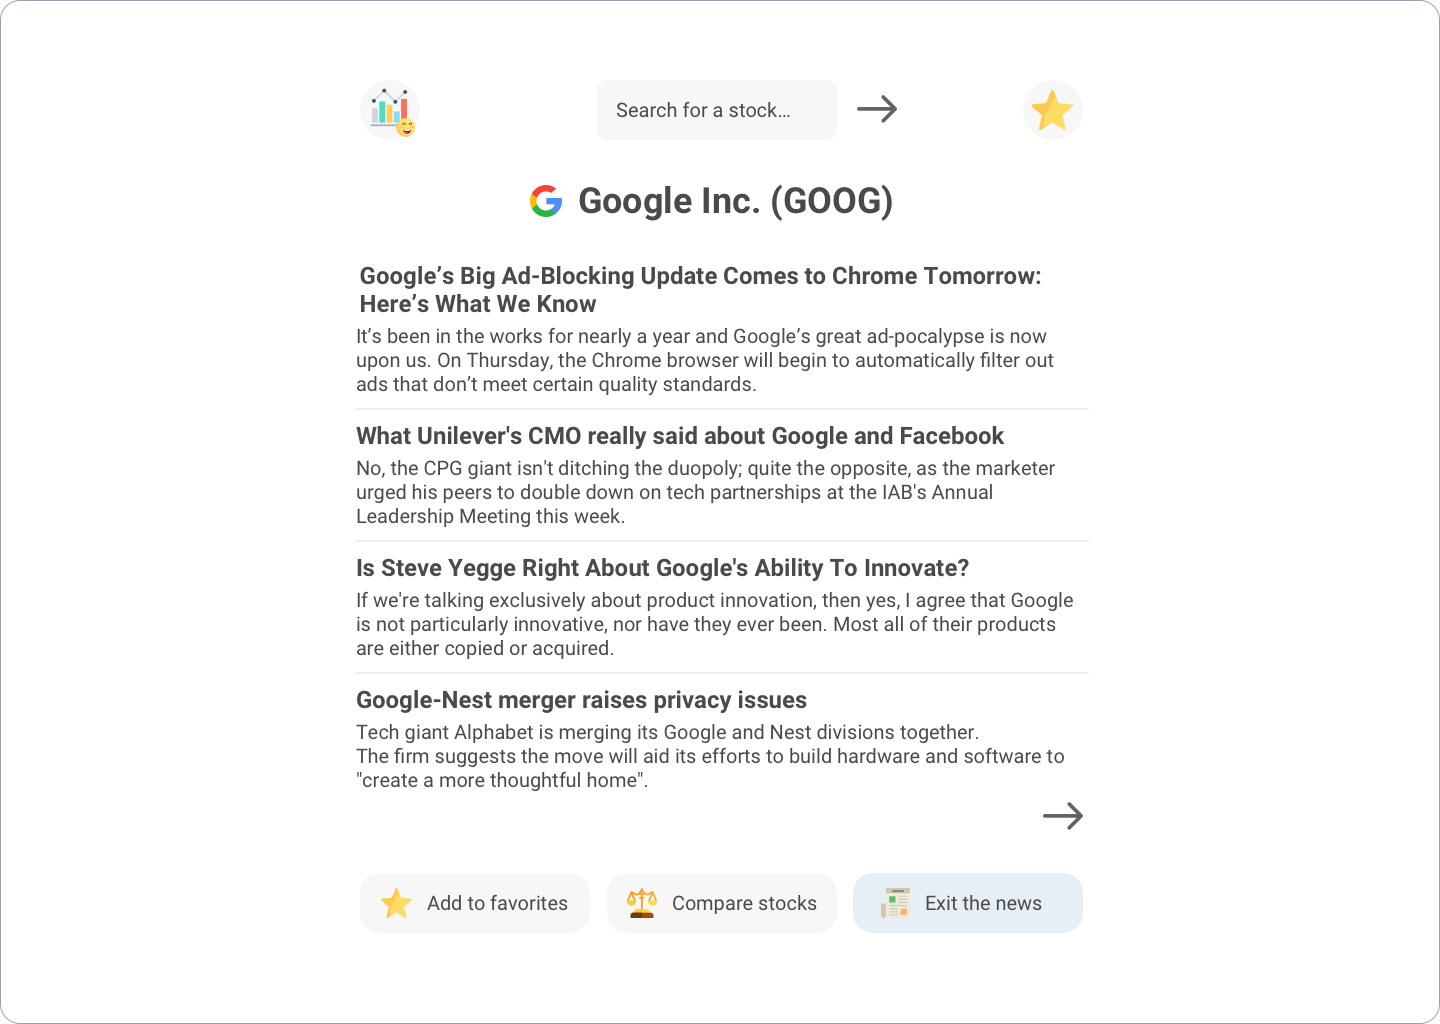
- Read latest news articles about a stock to conduct research on the news sources behind the sentiment rating
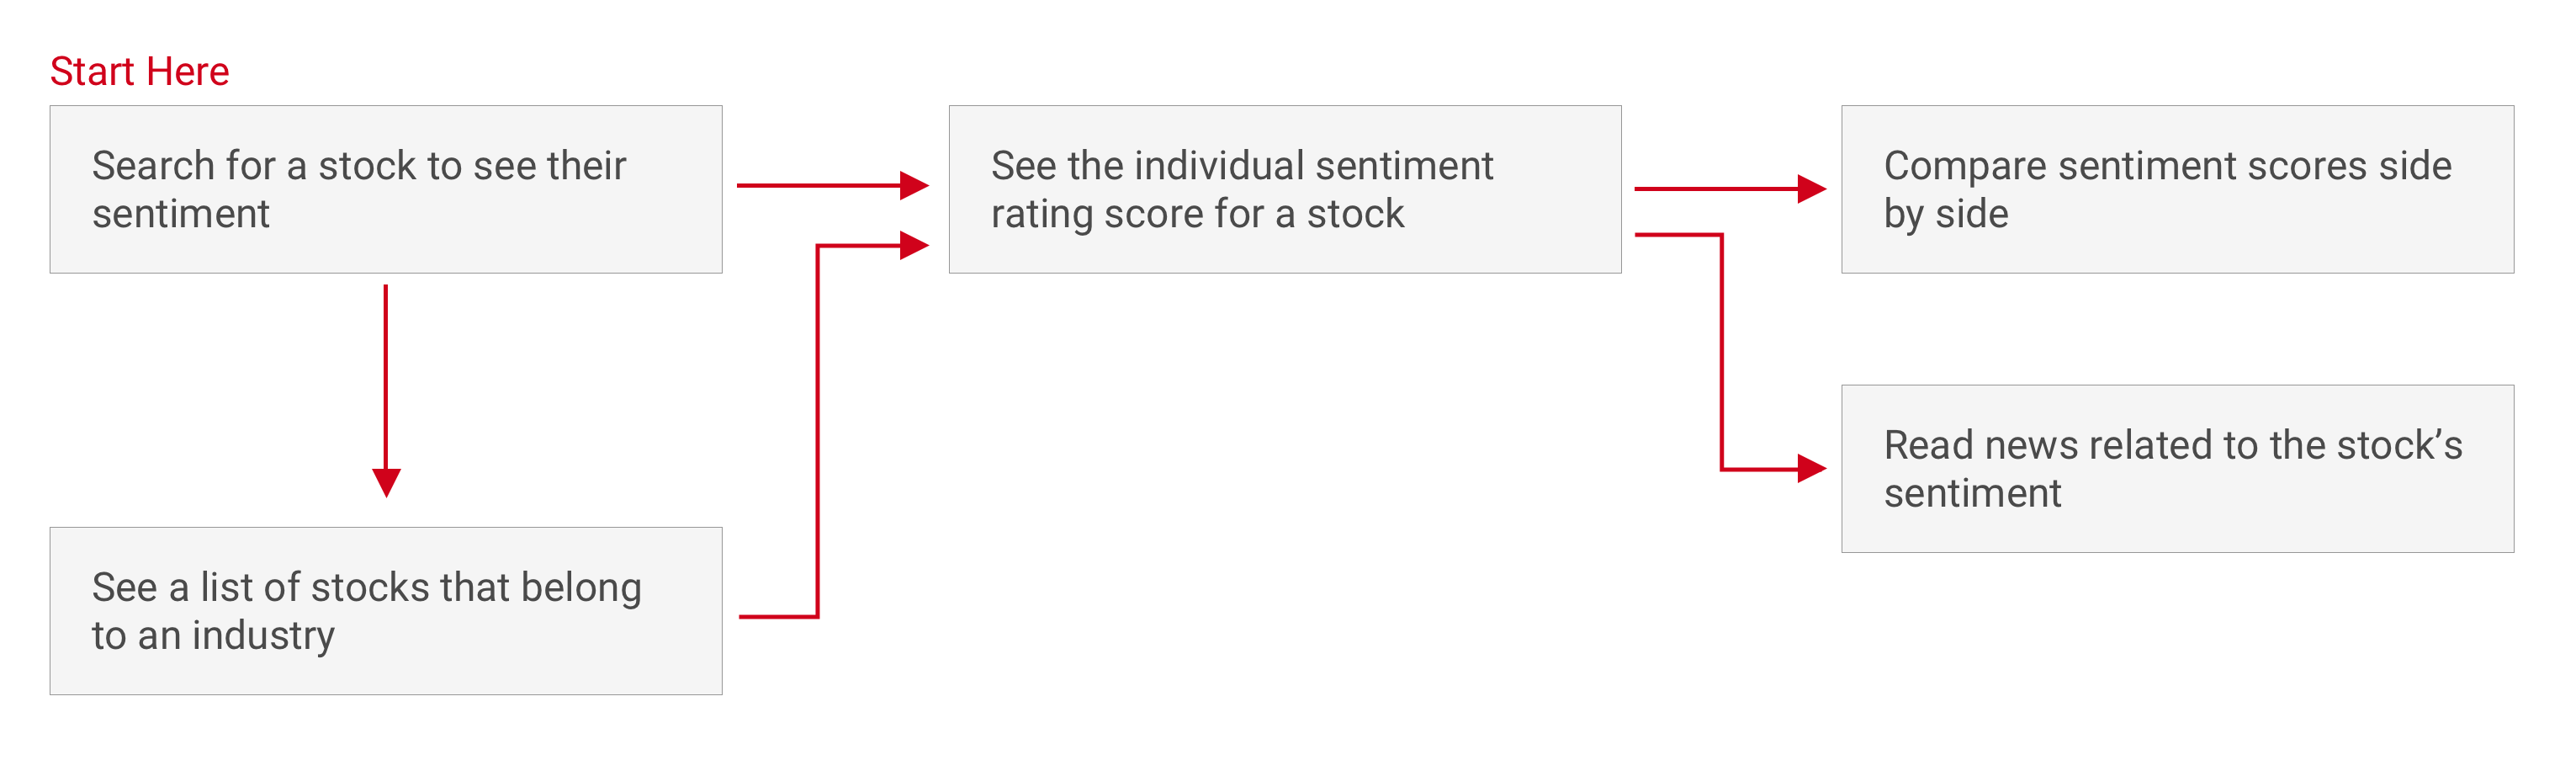
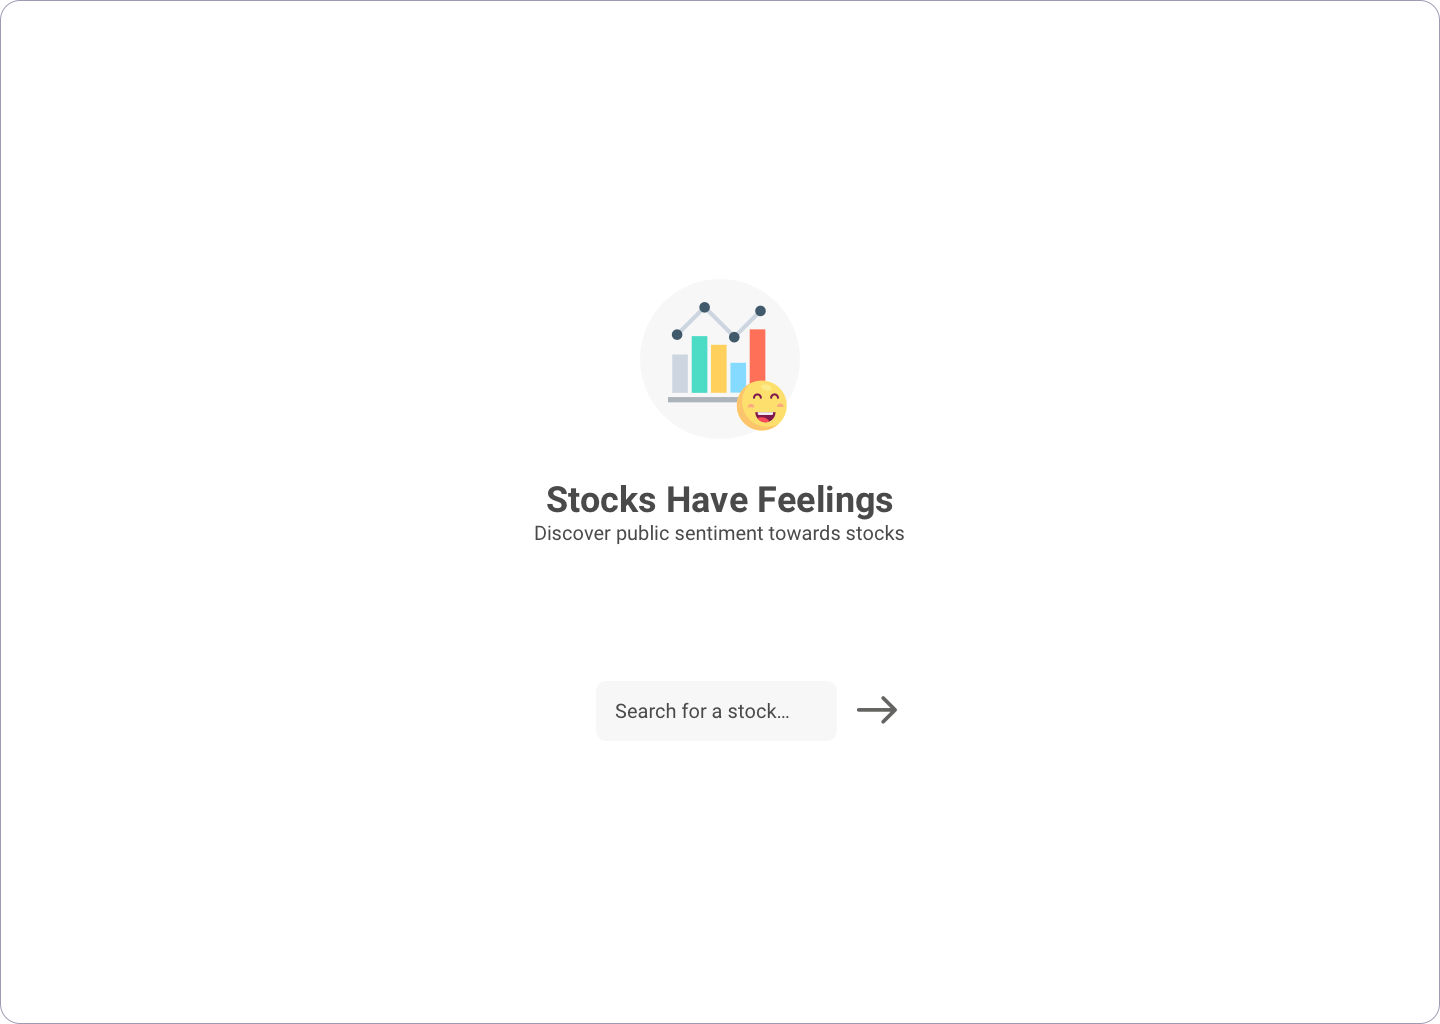
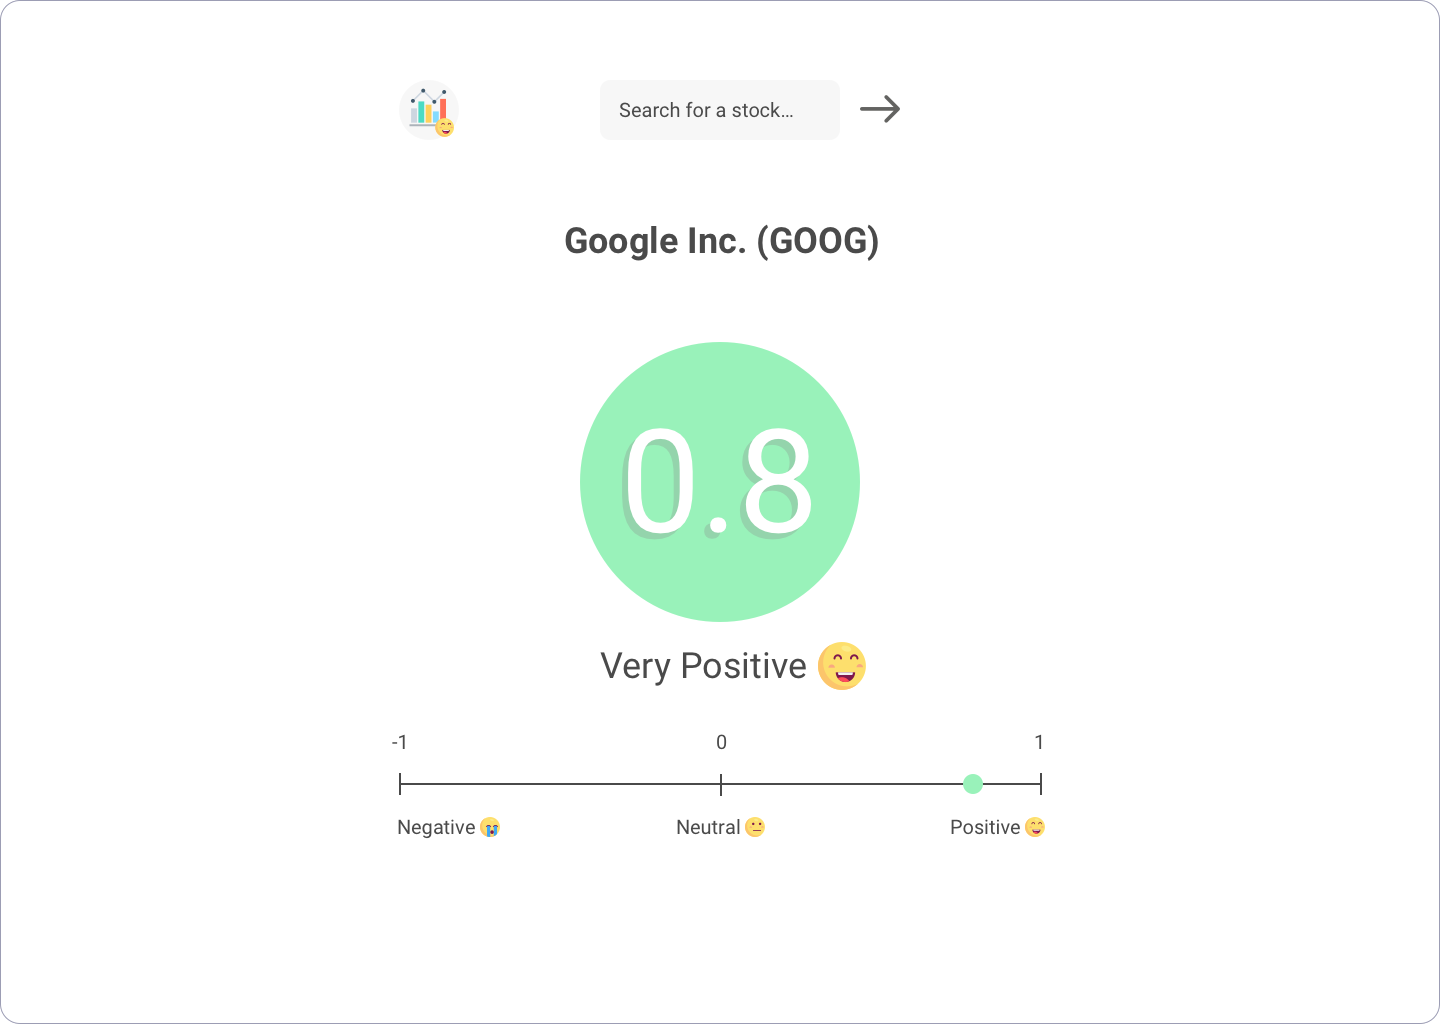
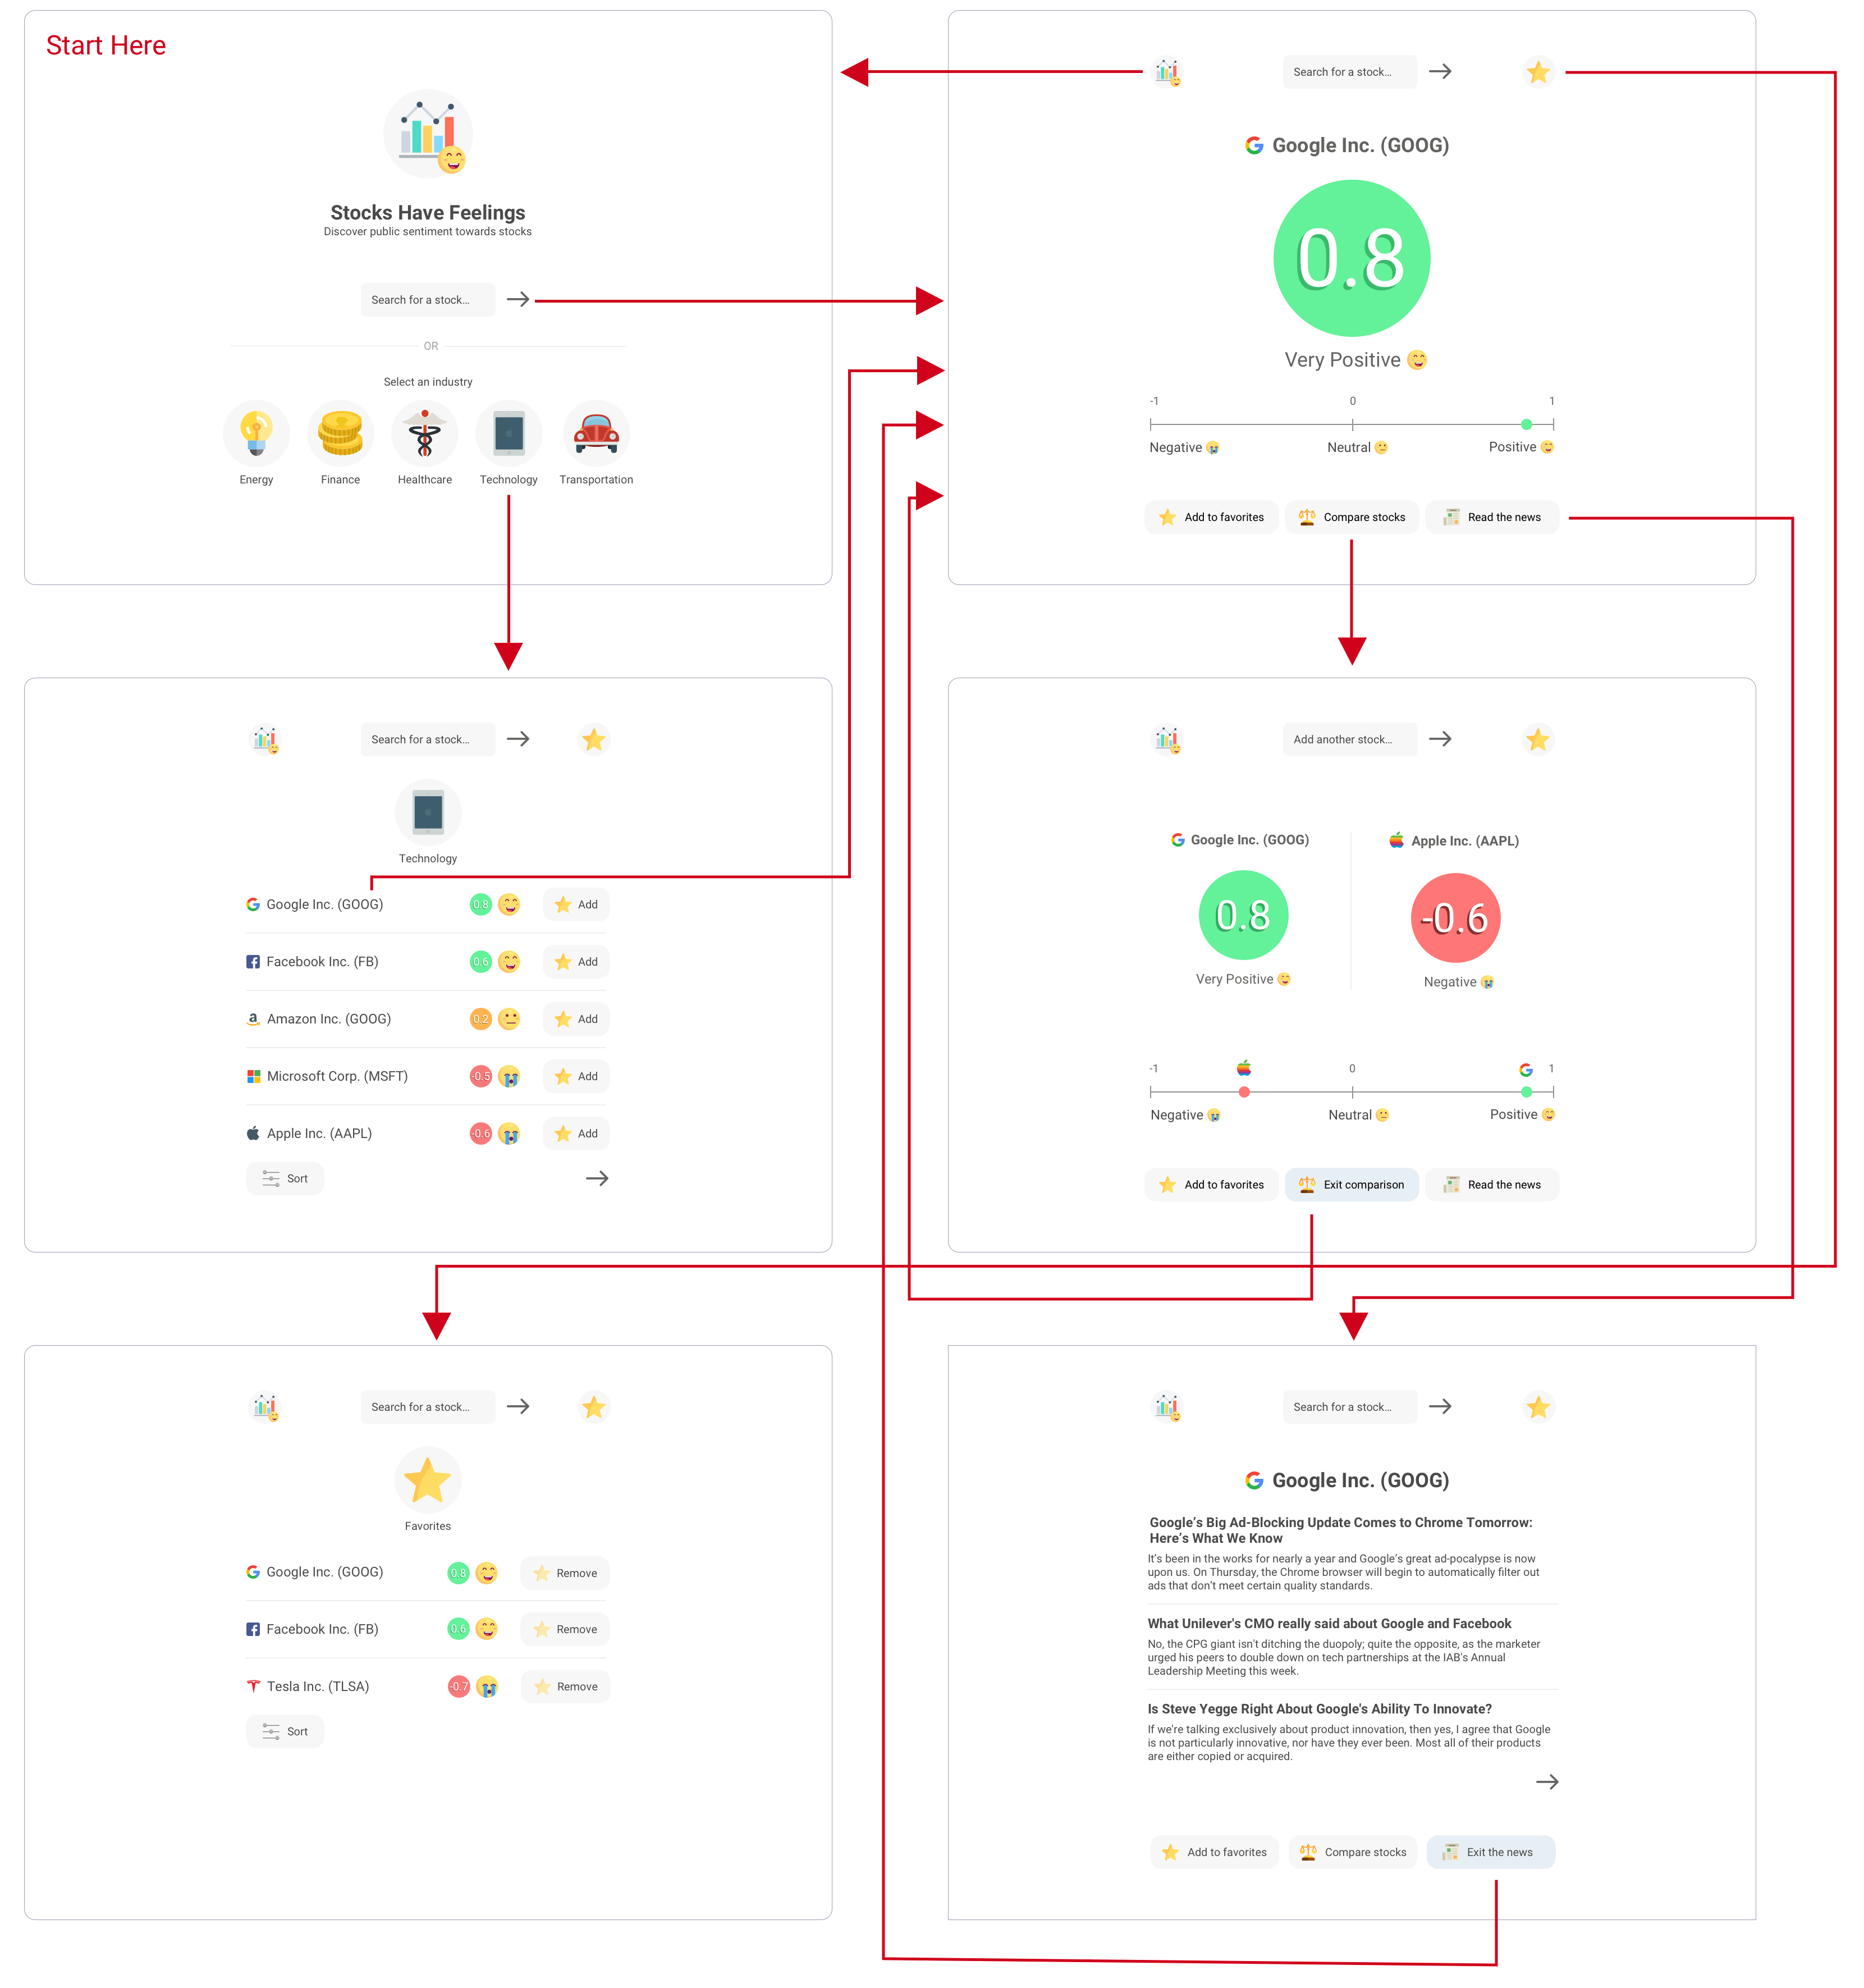
After determining the task flows and information architecture, corresponding wireframes and mockups were created, resulting in a mockup flow diagram.
The next step of the prototype is to code a front-end web prototype with real data. Instead of using mocked up data, this prototype would be able to use real sentiment using articles pulled from the NY times and analyzed by IBM's Watson Sentiment API. The technologies needed to create such as prototype include:
- HTML
- CSS
- JavaScript (jQuery)
- New York Times API
- IBM Watson Sentiment API
When the user searches for a stock, the New York Times API will be called and return several news articles about the stock's company. These news articles will then be fed into the Watson sentiment API to calculate an average sentiment rating.


Made with  by Jesse
by Jesse

